Want to grow your e-commerce business? Start with your data.
Tracking the right metrics can help you improve sales, reduce costs, and keep customers coming back. Here’s what you need to focus on:
-
Customer Lifetime Value (CLV): Measure the total profit a customer brings to your business over time.
-
Conversion Rate: See how many visitors turn into buyers.
-
Cart Abandonment Rate: Spot issues in your checkout process.
-
Customer Return Rate: Track how often customers come back.
-
Average Order Value (AOV): Find out how much customers spend per transaction.
Use tools like Shopify Analytics, Hotjar, and Peel Analytics to track these metrics and make smarter decisions. Start analysing your data today to personalise shopping experiences, improve efficiency, and boost revenue.
The 7 KPIs to Measure Your Shopify E-Commerce Store

Core E-commerce Metrics
Key metrics are essential for making informed decisions in e-commerce.
Customer Lifetime Value
Customer Lifetime Value (CLV) estimates the total profit a customer generates over their relationship with your business. It helps determine how much you can spend on acquiring customers without losing profitability.
CLV = Existing Customer Equity + Future Customer Equity
Where:
-
Existing Customer Equity = Total Past Sales
-
Future Customer Equity = (Average Order Value) × (Average Number of Orders) × Max(0, (Average Tenure – Current Tenure))
For example, if a customer spends NZ$150 per order, makes four purchases a year, and remains loyal for three years, their CLV would be approximately NZ$1,800.
"Customer lifetime value helps you understand and gauge current customer loyalty. If customers continue to purchase from you time and time again, that's usually a good sign you're doing the right things in your business. Furthermore, the larger a customer lifetime value, the less you need to spend on your customer acquisition costs." – Shopify Staff [3]
Website Conversion Rate
Conversion rate measures how effectively your site turns visitors into buyers. The table below highlights how different traffic channels perform in terms of click-through rates [2]:
| Channel | Average Click-Through Rate |
|---|---|
| Search Ads | 1.66% |
| Display Ads | 0.45% |
| Email Campaigns | 2.01% |
Shopping Cart Abandonment
Shopping cart abandonment happens when customers add items to their cart but don’t finish the checkout process. If abandonment rates approach 95%–100%, it’s a red flag that your checkout process may need immediate attention.
Customer Return Rate
The customer return rate indicates how many customers come back to make repeat purchases. This metric pairs well with the Net Promoter Score (NPS), where scores above 50 are strong, and scores over 75 are considered exceptional [2].
Average Purchase Value
Average Order Value (AOV) reflects how much customers typically spend per transaction. To find AOV, divide total revenue by the number of orders. For instance, if your monthly revenue is NZ$50,000 from 500 orders, your AOV would be NZ$100.
Tracking these metrics regularly can help you spot issues, identify trends, and monitor your business's overall health. Up next, we’ll look at tools that make monitoring these metrics easier.
sbb-itb-f46a14b
Analytics Tools Guide
To make sense of your metrics and take action, you need the right analytics tools. Below are some platforms designed to help you improve your online performance.
Shopify Dashboard Features
The Shopify Analytics dashboard acts as a central hub for tracking your store's performance. It updates data every minute, giving you near real-time insights into key business metrics[4]. You can customise the dashboard by managing metric cards and using comparison tools to review performance over specific timeframes across all sales channels. Data on sales and visitors is displayed both as numbers and through graphs that highlight percentage changes[4].
Almond Labs' Roadmap Tools

Almond Labs' Roadmap Tools integrate directly with Shopify, offering detailed insights into customer behaviour and campaign results. These tools are designed for lifestyle brands and include features like campaign tracking, customer segmentation analysis, monitoring loyalty programme engagement, and managing tag libraries for better data organisation. They help you make smarter decisions to streamline operations.
Hotjar Analysis Tools

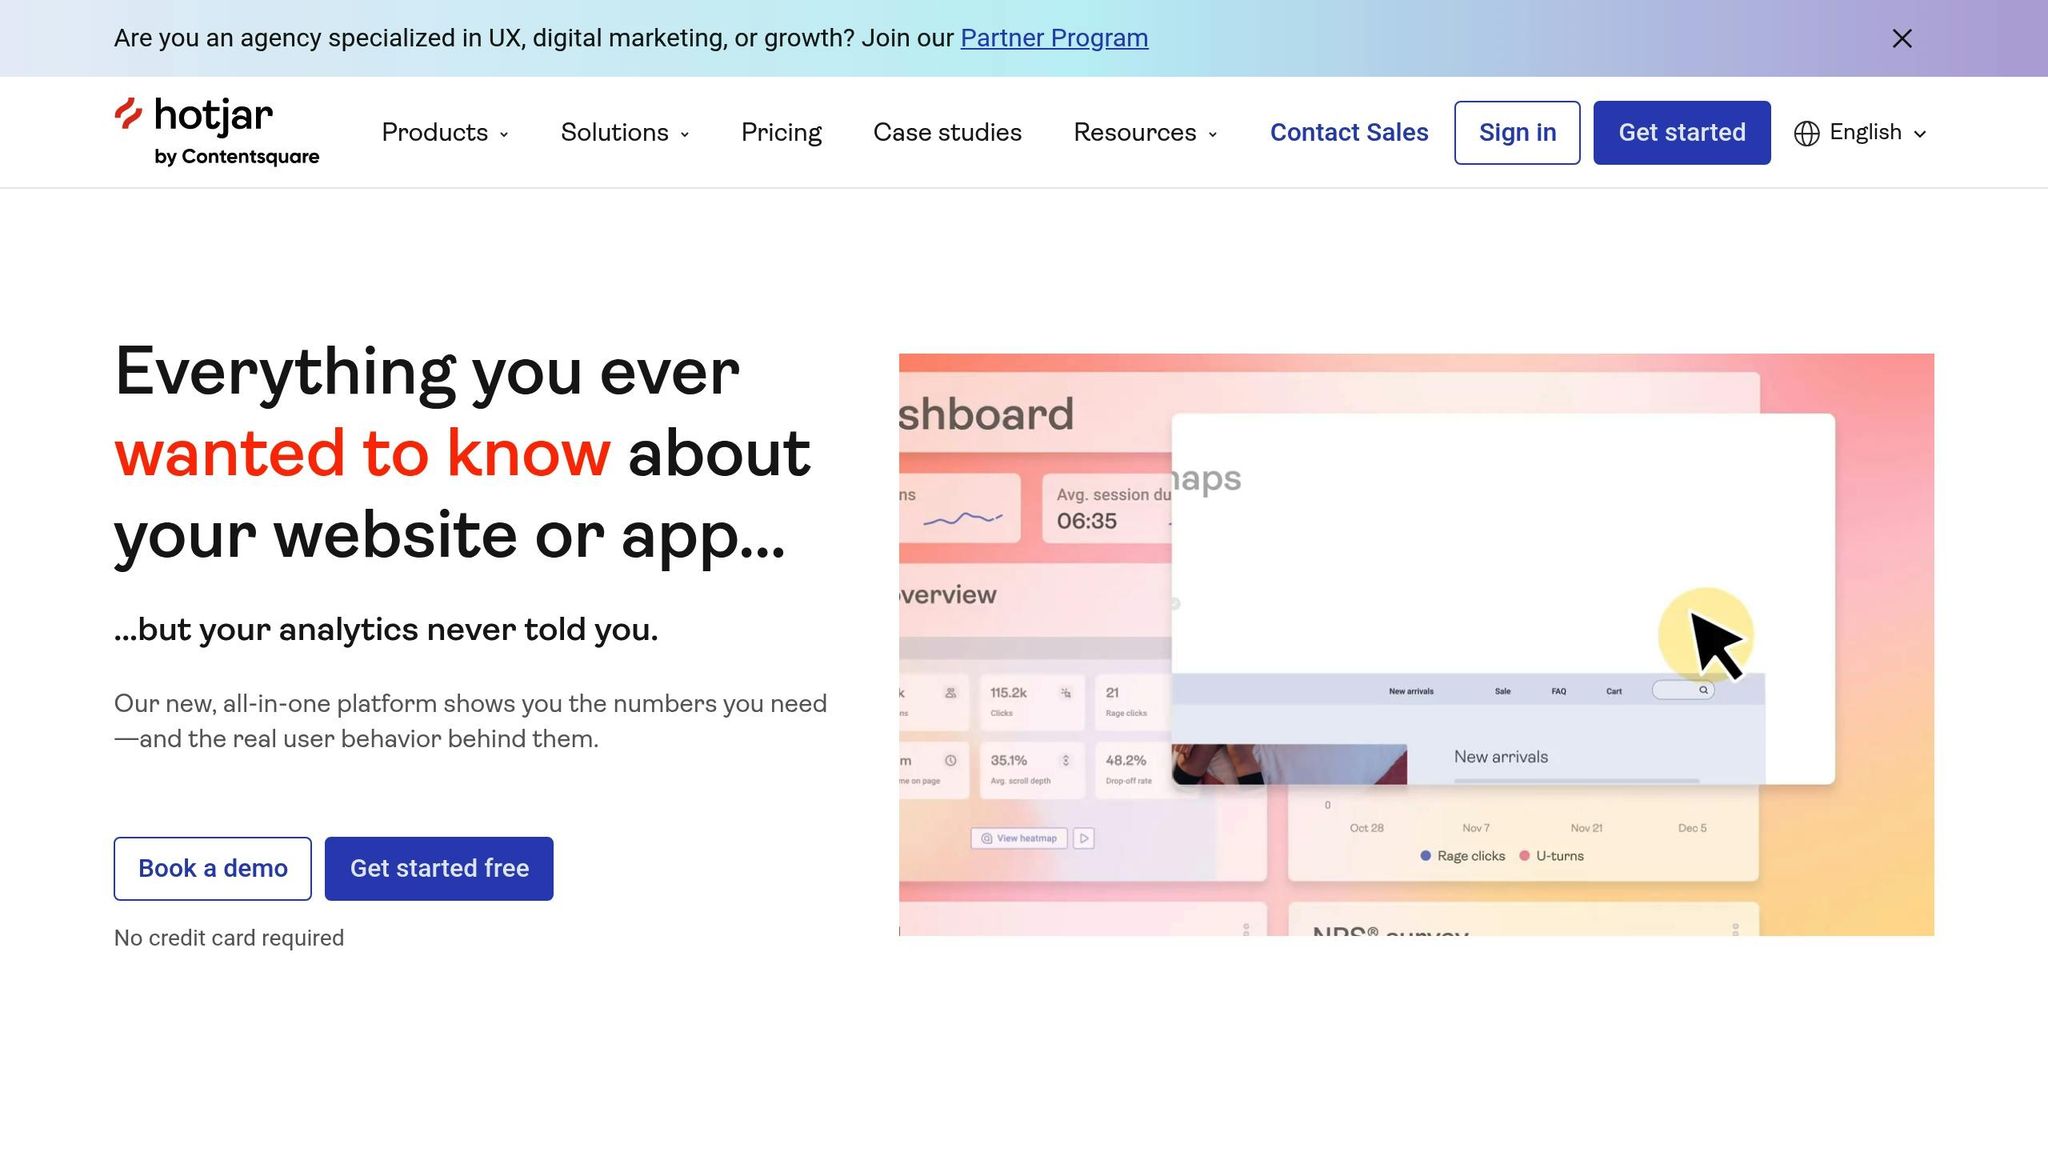
Hotjar goes beyond standard analytics by showing how customers interact with your store. Its features include:
-
Heatmaps: See where users click and how far they scroll.
-
Session Recordings: Watch real visitor interactions.
-
Feedback Polls: Collect direct user feedback.
-
Form Analytics: Pinpoint where users drop off in forms.
Peel Analytics Platform

Peel Analytics specialises in customer cohort analysis and retention tracking[5]. It allows e-commerce businesses to group customers by purchasing trends, track retention rates across segments, analyse customer journey touchpoints, and assess the impact of personalisation strategies.
When used together, these tools provide a detailed view of your e-commerce operations, helping you regularly review data and make decisions that can grow your business.
Improving Your Metrics
Let's dive into practical ways to improve the metrics discussed earlier.
Boost Sales Conversion
Focus on making the buying process as smooth as possible. Simplify your checkout process by reducing unnecessary form fields and offering guest checkout options. According to Shopify data, AI shopping assistants can increase conversions by up to ten times [6].
"CRO is an ongoing process of testing, learning, and improving your site's performance. By analyzing how users interact with your site, you can identify opportunities to remove obstacles, streamline the experience, and ultimately drive more conversions." [6]
Here are some tips to improve conversions:
-
Organise products clearly with easy-to-navigate categories.
-
Build trust by displaying badges, reviews, and secure payment options.
-
Speed matters - ensure your site loads in under 3 seconds.
-
Think mobile-first with layouts that work seamlessly on smaller screens.
Lower Cart Abandonment
Be upfront about costs like shipping to avoid surprises at checkout. Creating urgency with limited-time offers can also help, but make sure these offers are genuine to maintain customer trust. A Shopify retailer specialising in travel accessories shared their approach:
"I believe the current way to win in the market is CRO & optimising the stuff you are already doing but getting data behind making any decisions. We've done pricing tests and saw a 60% increase in conversion." [6]
Reducing cart abandonment not only improves conversions but also builds trust and sets the stage for long-term customer relationships.
Increase Return Customers
Retaining customers is just as important as acquiring new ones. Personalisation is key, especially with the average e-commerce email open rate sitting at 15.68% [2]. Try these strategies:
-
Targeted emails: Use purchase history and browsing behaviour to create personalised campaigns.
-
Loyalty programmes: Offer tiered rewards to encourage repeat purchases.
-
Customer feedback: Use insights from reviews and surveys to refine your product offerings.
Raise Order Values
Use your analytics to fine-tune how you present and price products. Upselling and cross-selling are great ways to increase the value of each order.
As Kate Collinson puts it:
"The beauty of data is not in the actual numbers - it's in the story we can tell from them" [1]
Keep tracking your improvements with analytics tools and adjust your strategies as needed to maximise results.
Conclusion
Data is at the heart of e-commerce success. Metrics like Customer Lifetime Value and Cart Abandonment rates provide the groundwork for improving operations and driving growth.
For New Zealand retailers, understanding analytics means decoding customer behaviour and tailoring strategies to local shopping habits. These insights can turn raw data into practical actions that fuel business progress.
A great example is Annmarie Skin Care, which consolidated its scattered data to get a clearer picture of its marketing performance, subscription trends, and customer lifetime value. This approach led to tangible results.
By focusing on key metrics, every outcome - whether a win or a challenge - becomes a chance to learn and improve. Tools like Almond Labs make it easier for Kiwi e-commerce brands to monitor these metrics and make informed decisions.
Brands that embrace customer data are better positioned for success. With the right tools and a focus on the right numbers, you'll be ready to thrive in New Zealand's digital marketplace.
Heading 1
Heading 2
Heading 3
Heading 4
Heading 5
Heading 6
Lorem ipsum dolor sit amet, consectetur adipiscing elit, sed do eiusmod tempor incididunt ut labore et dolore magna aliqua. Ut enim ad minim veniam, quis nostrud exercitation ullamco laboris nisi ut aliquip ex ea commodo consequat. Duis aute irure dolor in reprehenderit in voluptate velit esse cillum dolore eu fugiat nulla pariatur.
Block quote
Ordered list
- Item 1
- Item 2
- Item 3
Unordered list
- Item A
- Item B
- Item C
Bold text
Emphasis
Superscript
Subscript


